



 Healthcare App Development Services
 Real Estate Web Development Services
 E-Commerce App Development Services
 E-Commerce Web Development Services
 Blockchain E-commerce Development Company
 Fintech App Development Services
 Fintech Web Development
 Blockchain Fintech Development Company
 E-Learning App Development Services
 Restaurant App Development Company
 Mobile Game Development Company
 Travel App Development Company
 Automotive Web Design
 AI Traffic Management System
 AI Inventory Management Software
 Machine Learning Development
 ChatGPT integration services
  AI Development Company
  AI Integration Services
  Generative AI Development Services
  Natural Language Processing Company
 Mobile App Development
  IOS App Development
  Android App Development
  Cross-Platform App Development
  Augmented Reality (AR) App Development
  Virtual Reality (VR) App Development
  Web App Development
  SaaS App Development
 Flutter
  React Native
  Swift (IOS)
  Kotlin (Android)
  Mean Stack Development
  AngularJS Development
  MongoDB Development
  Nodejs Development
  Database Development
 Ruby on Rails Development
 Expressjs Development
  Full Stack Development
  Web Development Services
  Laravel Development
  LAMP Development
  Custom PHP Development
  .Net Development
  User Experience Design Services
  User Interface Design Services
  Automated Testing
  Manual Testing
  Digital Marketing Services
 Ride-Sharing And Taxi Services
 Food Delivery Services
 Grocery Delivery Services
 Transportation And Logistics
 Car Wash App
 Home Services App
 ERP Development Services
 CMS Development Services
 LMS Development
 CRM Development
 DevOps Development Services
 AI Business Solutions
 AI Cloud Solutions
 AI Chatbot Development
 API Development
 Blockchain Product Development
 Cryptocurrency Wallet Development
 About Talentelgia
  Our Team
  Our Culture
 Healthcare App Development Services
 Real Estate Web Development Services
 E-Commerce App Development Services
 E-Commerce Web Development Services
 Blockchain E-commerce
Development Company
Blockchain E-commerce
Development Company Fintech App Development Services
 Finance Web Development
 Blockchain Fintech
Development Company
Blockchain Fintech
Development Company E-Learning App Development Services
 Restaurant App Development Company
 Mobile Game Development Company
 Travel App Development Company
 Automotive Web Design
 AI Traffic Management System
 AI Inventory Management Software
 AI Development Company
 ChatGPT integration services
 AI Integration Services
 Machine Learning Development
 Machine learning consulting services
 Blockchain Development
 Blockchain Software Development
 Smart contract development company
 NFT marketplace development services
 Asset tokenization companies
 DeFi Wallet Development Company
 IOS App Development
 Android App Development
 Cross-Platform App Development
 Augmented Reality (AR) App
Development
Augmented Reality (AR) App
Development Virtual Reality (VR) App Development
 Web App Development
 Flutter
 React
Native
React
Native Swift
(IOS)
Swift
(IOS) Kotlin (Android)
 MEAN Stack Development
 AngularJS Development
 MongoDB Development
 Nodejs Development
 Database development services
 Expressjs Development
 Full Stack Development
 Web Development Services
 Laravel Development
 LAMP
Development
LAMP
Development Custom PHP Development
 User Experience Design Services
 User Interface Design Services
 Automated Testing
 Manual
Testing
Manual
Testing About Talentelgia
 Our Team
 Our Culture
You make a minor change to the user interface and run your functional test. Everything looks great and runs just as it should. But once it goes live, users notice overlapping and alignment issues with certain UI elements on some devices.
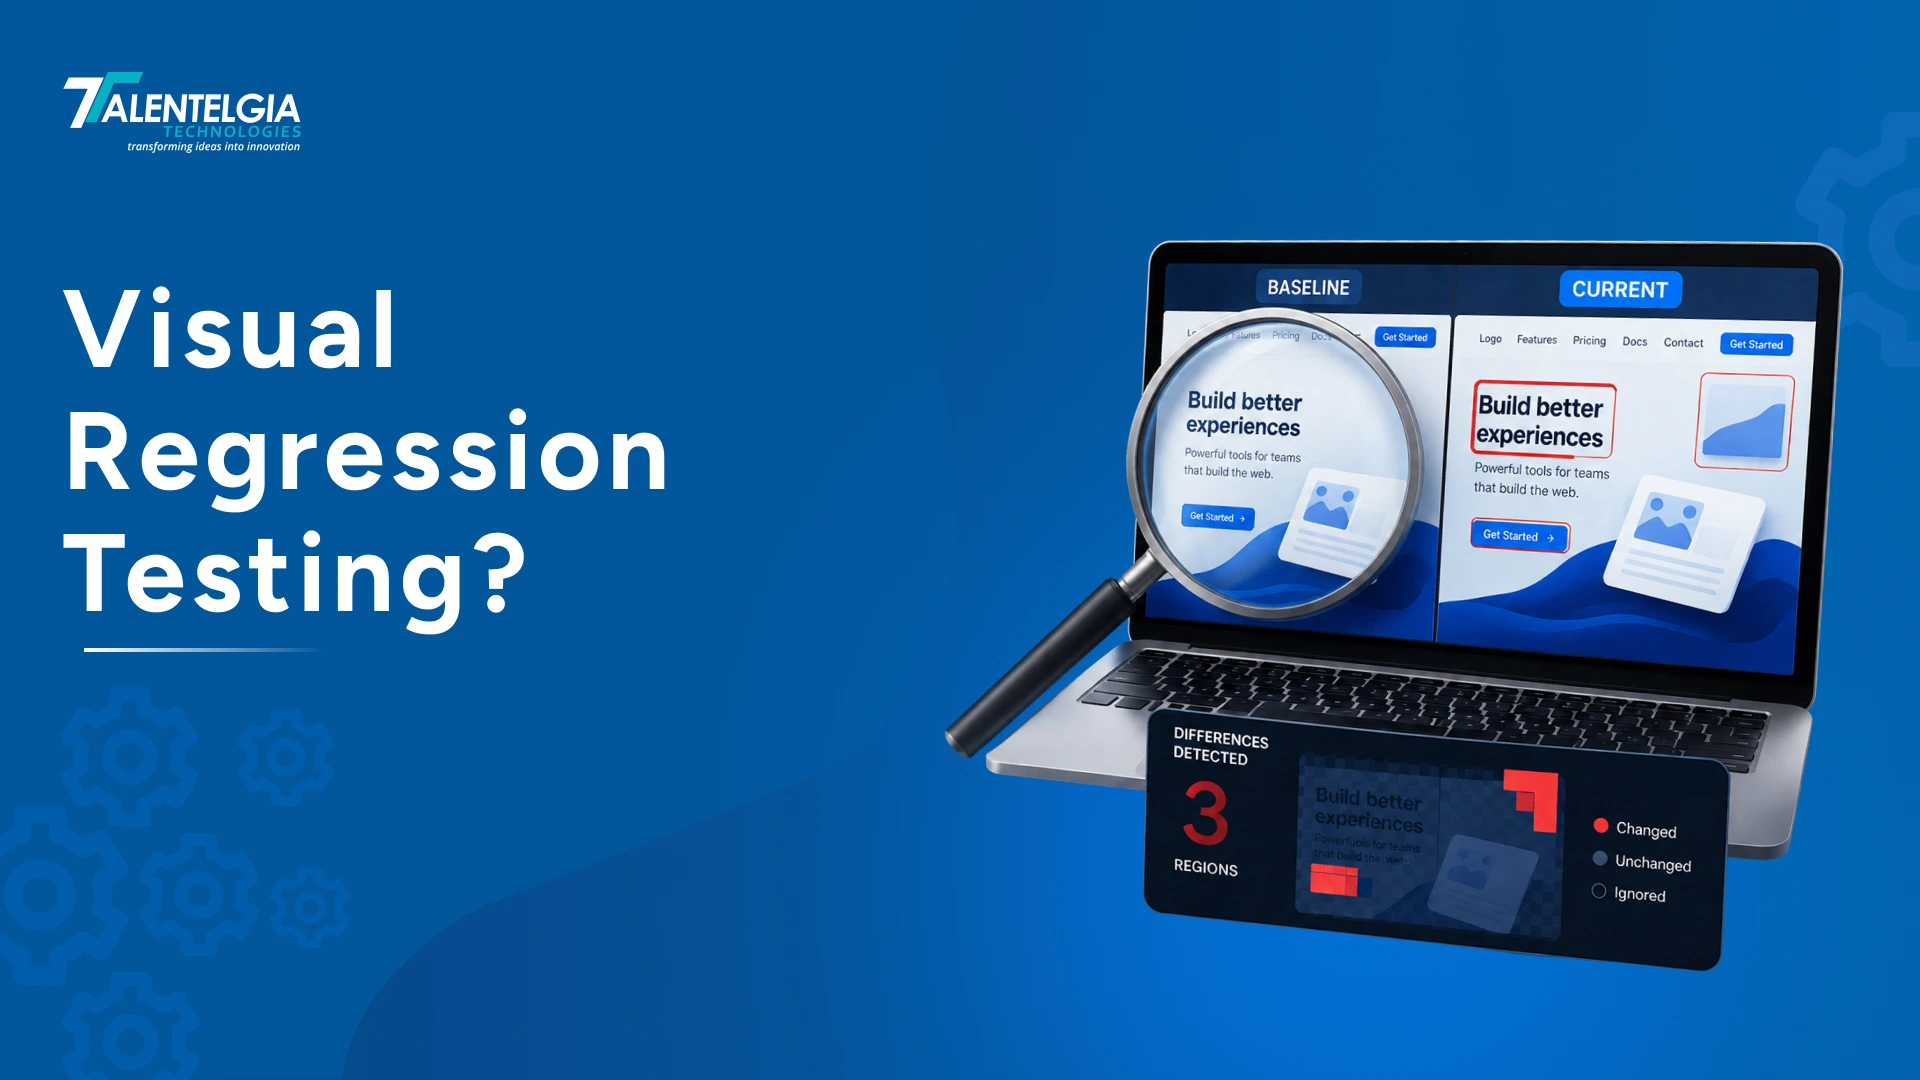
This is precisely what Visual Regression Testing (VRT) is designed to catch. By comparing screenshots of your application’s interface before and after a particular modification, VRT can help detect any unintentional discrepancies in the visual aspects of the application.
In this article, we will explain how visual regression testing saves you from failures before users face them. We will explain what visual regression testing means, what methods exist, and what modern QA teams use for this purpose.
What Is Visual Regression Testing?
Visual regression testing (VRT) is the practice of comparing rendered screenshots of your UI — before and after a change — to catch unintended visual differences that functional tests can’t see.
Functional and unit tests answer “does the code work?” Visual regression testing answers a different question entirely: “does it still look right?” A button can be perfectly clickable, wired to the correct handler, and pass every Cypress assertion, while sitting 200px off-grid, half-clipped by an overflow, or rendered in the wrong theme. The DOM may be technically correct, but the rendered interface can still be visually broken.
At its core, VRT is just three steps repeated forever: capture a baseline screenshot of a known-good state, capture a new screenshot after a change, and diff the two. If the difference exceeds an agreed threshold, a human reviews it and either approves the new look as the new baseline, or flags it as a bug.
Also Read: Software Testing Basics: Everything You Need to Know
Why Is Visual Regression Testing Important?
Every layer of the modern front-end stack, CSS frameworks, design tokens, third-party fonts, browser rendering engines, and dynamic content, is a place where something can shift a pixel without ever touching application logic. Here’s what VRT is actually protecting you from:
- CSS bleed: A shared class renamed or a specificity change silently restyles a component three routes away.
- Dependency Upgrades: A minor bump to a UI library or CSS framework changes default paddings, line-heights, or shadows across the app.
- Responsive Breakage: A layout that’s perfect at 1440px collapses into overlapping text at 768px, and nobody manually checks every breakpoint on every PR.
- Cross-browser drift: Flexbox gaps, font rendering, and scrollbar behavior differ just enough between Chromium, WebKit, and Firefox to break a layout in one engine only.
- Third-party payload risk: A rebrand, translation string, or dynamic banner from marketing pushes content that’s longer than any designer tested for.
- Design-system erosion: Small, “harmless” one-off overrides accumulate until your button component has 14 silent variants nobody approved.
When Should You Run Visual Regression Tests?
VRT is cheap to run and expensive to skip, but running it everywhere without a strategy just produces noise. A good rule of thumb from teams that run this well: component-level VRT on every commit (fast, isolated, cheap to triage), and page-level VRT on every pull request plus nightly (slower, but covers integration and layout composition that isolated components can’t reveal). Here’s where it earns its place in the delivery pipeline:
- Pre-Commit / Dev
Component-level snapshot checks in Storybook while building a new UI piece catch drift before it’s even pushed.
- Pull Request Gate
Full suite runs against the changed branch; diffs post directly as PR comments for review before merge.
- Scheduled Regression
Broader cross-browser / cross-viewport matrix that’s too slow to run on every commit.
- Release Candidate
Full page-level sweep across critical user journeys, checkout, onboarding, pricing, as a release gate.
- Production Smoke
Lightweight checks against the live site after deploy, to catch CDN, cache, or environment-specific rendering issues.
How Does Visual Regression Testing Work?
The standard workflow is straightforward: capture a baseline screenshot, capture a new screenshot after a change, compare them, then review any differences to decide whether they are intentional or defects. The quality of the process depends heavily on stable test data, fixed viewports, controlled fonts, and masking of dynamic regions. Strip away the tooling and every VRT workflow, whether it’s a $30/month SaaS or a homegrown Playwright script, follows the same five-stage loop:
- Establish the Baseline
Render the UI in a known-good state and store the screenshot as ground truth. This baseline is a contract: “this is what correct looks like” until a human says otherwise.
- Capture the Candidate
After a code change, re-render the same view — same viewport, same data, same wait conditions — and capture a new screenshot.
- Separate the Two Images
Run a pixel or perceptual comparison algorithm to isolate exactly which regions changed, producing a heatmap or overlay of the delta.
- Apply a Threshold
Ignore differences below an agreed sensitivity (anti-aliasing noise, sub-pixel font rendering) and flag everything above it for review.
- Review and Reconcile
A human, usually the PR author or a QA reviewer, approves the diff as intentional (promoting it to the new baseline) or rejects it as a bug to fix.
Types of Visual Regression Techniques and Methods
Not all “diffing” is equal. The algorithm behind the comparison determines what you catch and how much noise you tolerate.
- Pixel-by-Pixel Comparison
The most literal method — compares raw pixel values between two images. Extremely sensitive, catches everything, but also flags anti-aliasing artifacts and 1px font-rendering differences as “changes.” Tools: Resemble.js, pixelmatch.
- Perceptual Diffing (SSIM)
Structural Similarity Index compares luminance, contrast, and structure the way a human eye would, rather than exact byte values. Tolerates minor rendering noise while still catching real layout shifts — the industry’s practical default.
- DOM / Structural Diffing
Instead of (or alongside) pixels, some tools compare the computed DOM tree, CSSOM, or bounding-box geometry of elements, useful for catching layout shifts even when colors are identical, and less noisy for animated or dynamic regions.
- AI-Assisted / “Visual AI”
Newer platforms (Applitools Eyes being the best-known) use machine learning to distinguish “meaningful” visual changes from cosmetic noise, ignoring dynamic ads or timestamps automatically while still catching a misaligned button, dramatically cutting false positives at the cost of vendor lock-in.
- Layout-Shift Metrics
Borrowed from performance tooling, measuring Cumulative Layout Shift (CLS)-style deltas to catch content that jumps during render, which a single static screenshot comparison can miss entirely.
Manual vs. Automated Visual Testing: What’s the Difference?
Manual visual review, a human scrolling through a staging build comparing it to designs, is still how most teams start, and it’s not obsolete even once automation exists. The two are complementary, not competing.
| Dimension | Manual Review | Automated VRT |
|---|---|---|
| Speed at scale | Slows down linearly with page count | Constant — hundreds of pages in minutes |
| Consistency | Varies by reviewer fatigue, attention | Pixel-exact, repeatable every run |
| Catches subjective issues | Brand feel, taste, “does this feel off” | Only what the algorithm is tuned to flag |
| Cross-browser/viewport coverage | Impractical beyond 2–3 combinations | Trivial to run a full matrix |
| Setup cost | None | Baseline management, CI wiring, threshold tuning |
| False positives | Rare, but reviewer misses things too | Common until thresholds/masking are tuned |
| Best for | Exploratory review, new features, brand-critical screens | Regression safety net on every commit |
Component-level vs. Page-Level Visual Regression
Treat component-level VRT as your unit tests and page-level VRT as your integration tests. Run the former on every commit for fast, precise feedback; reserve the latter for PRs and release gates where the coverage matters more than the speed. Where you point the camera changes what kind of bug you catch, and how fast the feedback loop runs.
Component-Level
Screenshots of an isolated component (usually from Storybook or a similar sandbox) in every state and prop combination it supports.
- Fast, no app boot, no routing, no data fetching
- Pinpoints the exact component that broke
- Great for design-system libraries shared across products
- Blind to integration issues; a button can look perfect alone and still collide with a sibling in a real layout
Page-Level
Full-page screenshots of real routes with real (or realistic seeded) data, across viewports.
- Catches composition bugs, overlaps, spacing conflicts, z-index wars
- Validates real user journeys end-to-end, not just pieces
- Slower, more flaky (ads, timestamps, animations, async data)
- A failure tells you something broke on the page, not exactly what
How To Overcome False Positives & Flakiness?
This is the section most tutorials skip, and the reason most VRT suites get disabled within six months of being turned on. Screenshots are deceptively unstable. Here’s what causes the noise, and how experienced teams neutralize it:
Font Loading Races
Web fonts swap in asynchronously; a screenshot taken a beat too early captures the fallback font.
Fix: wait for document.fonts.ready before capturing.
Animations and Transitions
CSS transitions caught mid-frame produce a different screenshot every run.
Fix: disable animations globally in the test environment via a CSS override.
Dynamic Content
Timestamps, ads, carousels, “3 people viewing this” widgets change every capture.
Fix: mask or stub these regions explicitly rather than letting them fail every diff.
Anti-Aliasing and Sub-Pixel Rendering
The same text rendered on two different GPU/OS combinations differs at the pixel level despite looking identical.
Fix: perceptual (SSIM) diffing and a sane tolerance threshold, not raw pixel matching.
Non-Deterministic Data
Random user avatars, live API responses, or non-seeded test data change the screenshot without any UI bug.
Fix: freeze test data and mock network responses for VRT runs specifically.
Environment Drift
Baselines captured on a developer’s laptop rarely match CI’s headless renderer.
Fix: capture and compare baselines inside the same containerized environment every time.
Best Tools for Visual Regression Testing
The right tool depends on budget, whether you already use Storybook, and how much false-positive suppression you want handled for you versus configured by hand.
| Tool | Type | Ideal Scope | AI Capabilities | Pricing Model |
|---|---|---|---|---|
| Percy (by BrowserStack) | Cloud SaaS | Page + Component | Visual Review Agent: Automatically groups matching layout changes. | Free tier (5K snapshots/mo); Paid plans start at $99/mo. |
| Applitools Eyes | Cloud SaaS | Page + Component | Visual AI: Strict, Content, Layout, and Text modes mimic human sight. | Custom Enterprise pricing (Free trial available). |
| Chromatic | Cloud SaaS | Component-Level | Storybook-Native: Captures interaction states and design tokens. | Generous Free tier; Paid plans start at $149/mo. |
| Playwright (Built-in) | Open Source | Page + Element | None: Relies on pixel-matching math algorithms. | 100% Free (Built directly into the core framework). |
| BackstopJS | Open Source | Page-Level | None: Framework-agnostic JSON-driven runner. | 100% Free (Self-hosted baseline storage). |
Wrapping Up
Regardless of whether you are testing your product for its branding details, color scheme, and key fonts, or making certain the app’s users could successfully click on the features necessary for processing transactions, one thing is undeniable: Nothing is trivial when it comes to testing. It enables you to build your reputation by developing an app with impeccable quality, enhance user experience, and possibly ultimately increase profitability.
At Talentelgia Technologies, we provide our clients with effective automated testing services, we bring the perfect interface and the best experience for your end user at the same time. If you want to check how we can improve your visual regression testing, contact us for a demonstration today.













 Sales Enquiries:
  Business queries:
  HR:
HR: 


