


 Healthcare Software Development Services
 Healthcare App Development Services
 Real Estate Web Development Services
 Real Estate App Development Company
 E-Commerce App Development Services
 E-Commerce Web Development Services
 Blockchain E-commerce Development Company
 Fintech Software Development
 Fintech App Development Services
 E-Learning App Development Services
 Restaurant App Development Company
 Mobile Game Development Company
 Travel App Development Company
 Automotive Web Design
 AI Traffic Management System
 AI Inventory Management Software
 Logistics App Development Services
 Machine Learning Development
 ChatGPT integration services
  AI Development Company
  AI Integration Services
  Natural Language Processing Company
 Mobile App Development
  IOS App Development
  Android App Development
  Cross-Platform App Development
  Augmented Reality (AR) App Development
  Virtual Reality (VR) App Development
  Web App Development
  SaaS App Development
 Custom Software Development Services
  Flutter
  React Native
  Swift (IOS)
  Kotlin (Android)
  Mean Stack Development
  AngularJS Development
  MongoDB Development
  Nodejs Development
  Database Development
 Ruby on Rails Development
 Expressjs Development
  Full Stack Development
  Web Development Services
  Laravel Development
  LAMP Development
  Custom PHP Development
  .Net Development
  User Experience Design Services
  User Interface Design Services
  Automated Testing
  Manual Testing
  Digital Marketing Services
 Ride-Sharing And Taxi Services
 Food Delivery Services
 Grocery Delivery Services
 Transportation And Logistics
 Car Wash App
 Home Services App
 ERP Development Services
 CMS Development Services
 LMS Development
 CRM Development
 DevOps Development Services
 AI Business Solutions
 AI Cloud Solutions
 AI Chatbot Development
 API Development
 Blockchain Product Development
 Cryptocurrency Wallet Development
 About Talentelgia
  Our Team
  Our Culture
 Healthcare App Development Services
 Real Estate Web Development Services
 E-Commerce App Development Services
 E-Commerce Web Development Services
 Blockchain E-commerce
Development Company
Blockchain E-commerce
Development Company Fintech App Development Services
 Blockchain Fintech
Development Company
Blockchain Fintech
Development Company E-Learning App Development Services
 Restaurant App Development Company
 Mobile Game Development Company
 Travel App Development Company
 AI Traffic Management System
 AI Inventory Management Software
 AI Development Company
 ChatGPT integration services
 AI Integration Services
 Machine Learning Development
 Machine learning consulting services
 Blockchain Development
 Blockchain Software Development
 Smart contract development company
 NFT marketplace development services
 Asset tokenization companies
 DeFi Wallet Development Company
 IOS App Development
 Android App Development
 Cross-Platform App Development
 Augmented Reality (AR) App
Development
Augmented Reality (AR) App
Development Virtual Reality (VR) App Development
 Web App Development
 Flutter
 React
Native
React
Native Swift
(IOS)
Swift
(IOS) Kotlin (Android)
 MEAN Stack Development
 AngularJS Development
 MongoDB Development
 Nodejs Development
 Database development services
 Expressjs Development
 Full Stack Development
 Web Development Services
 Laravel Development
 LAMP
Development
LAMP
Development Custom PHP Development
 User Experience Design Services
 User Interface Design Services
 Automated Testing
 Manual
Testing
Manual
Testing About Talentelgia
 Our Team
 Our Culture
Building a Lightweight, Cost-Effective Analytics Platform Without Spark
Most teams building an analytics platform start from the same assumption: you need Spark for compute, a warehouse like Snowflake or BigQuery for storage, and a stack of orchestration tools to hold it all together. That assumption comes with a cost — not just the infrastructure bill, but the weeks it takes a new engineer to understand the pipeline, and the operational overhead of running distributed systems sized for problems most teams don’t actually have.
We built a fully functional analytics platform on a different premise: that a small-to-medium analytics workload doesn’t need distributed systems at all. The stack has four pieces — DuckDB for compute, DuckLake for the storage and metadata layer, Apache Superset for visualization, and a custom React + Node.js layer for controlled, non-technical access. No Spark cluster, no traditional warehouse, and a total infrastructure bill under $50 a month.
Here’s how each piece works, what it’s actually good and not good at, and where this architecture holds up in practice.
Why Traditional Data Stacks Are Too Expensive for Modern Analytics
The standard architecture most companies default to looks like this: a distributed compute engine (Spark or Flink) processes data, a cloud warehouse (Snowflake, BigQuery) stores it, and a separate layer of ETL tools and orchestrators moves data between the two. It’s a proven design for petabyte-scale problems — which is exactly the issue, since most teams aren’t operating at that scale.
Where the costs show up:
- Infrastructure and licensing — cluster compute, warehouse credits, and BI tool seats add up fast, independent of engineering time.
- Deployment and maintenance complexity — cluster tuning, warehouse credit management, and pipeline monitoring all require specialized, ongoing attention.
- Latency in batch-heavy systems — a design meant for huge volumes often adds delay that doesn’t match how fast the business actually needs answers.
- Scale mismatch — for datasets in the gigabyte-to-low-terabyte range, the whole architecture is disproportionate to the problem it’s solving.
Where the industry is actually shifting:
- Embedded, in-process query engines that run inside the application instead of as a separately managed service.
- Local-first processing that skips the network round-trip to a remote warehouse for every query.
- Open file formats (Parquet, CSV) that keep data portable instead of locked into a vendor’s storage format.
- A cleaner split between storage and compute — cheap object storage paired with a fast query engine, rather than a single monolithic system doing both.
That shift — and the fact that single-node hardware now comfortably handles workloads that used to require a cluster — is what makes this stack viable.
The Modern Analytics Stack Explained
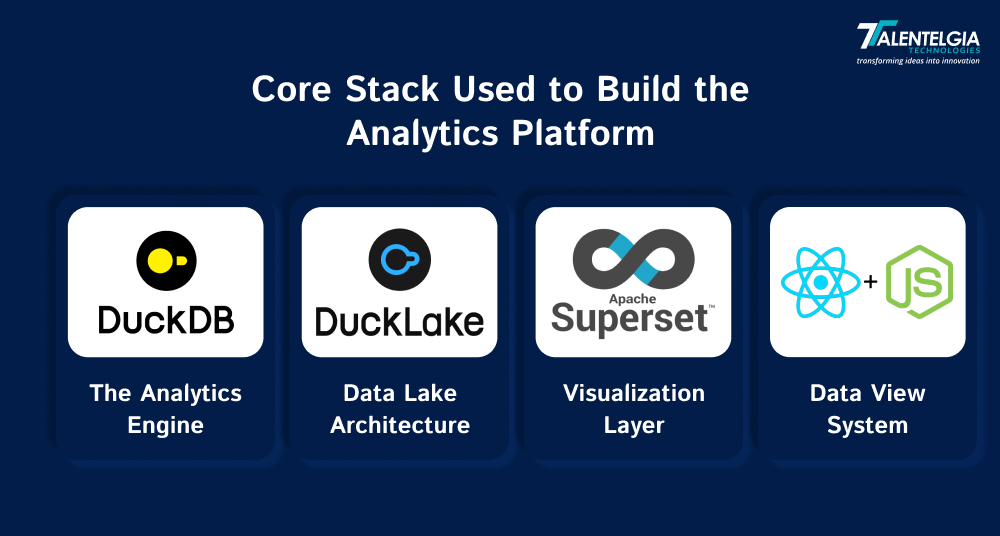
1. DuckDB — The Analytics Engine
DuckDB is an in-process, MIT-licensed SQL OLAP database — the analytical equivalent of SQLite. It runs as a library inside your application or server process, not as a separately deployed service, and ships as a roughly 20MB binary with no external dependencies.
Advantages:
- No server, daemon, or cluster to deploy or maintain — it runs where your code runs.
- Reads Parquet, CSV, and other columnar formats directly, without a separate import step.
- Vectorized execution engine processes data in batches rather than row by row, which is the main source of its speed advantage over traditional row-oriented databases.
- Embeds in 15+ languages, including Python, Node.js, Go, and Rust.
- On ClickBench — the most widely used public OLAP benchmark — DuckDB reached the top spot among open-source engines in late 2025, on the strength of its vectorized engine and fast in-process execution.
Where it’s genuinely limited:
- It’s built for single-node analysis, not as a shared, multi-user data warehouse — high-concurrency, many-simultaneous-writer scenarios aren’t its strength.
- Performance is best when the working dataset fits comfortably in memory on one machine; it isn’t designed to scale horizontally across a cluster the way Spark or ClickHouse are.
- Write concurrency and multi-process access patterns need careful design — it wasn’t built as a “many services writing at once” database.
That last limitation is exactly the gap DuckLake exists to close.
2. DuckLake — The Lakehouse Layer
This is the piece worth being precise about, because it’s easy to undersell: DuckLake isn’t just “Parquet files in object storage.” It’s an open lakehouse table format, released by the creators of DuckDB, built around one specific design decision — instead of tracking table metadata through scattered manifest and log files (the way Apache Iceberg and Delta Lake do), DuckLake stores all of that metadata in an actual SQL database: PostgreSQL, SQLite, or DuckDB itself acting as the catalog.
The data still lives as ordinary Parquet files in object storage (S3, GCS, Azure Blob, or local disk) — DuckLake doesn’t change that part. What changes is how updates to that data are tracked and coordinated.
What it gives you that plain “Parquet on S3” doesn’t:
- Full ACID transactions across multiple tables and schemas, not just single-file writes.
- Schema evolution — columns can be added, removed, or retyped without rebuilding the table.
- Time travel and rollback — you can query a table as it existed at a previous snapshot.
- A fix for the lakehouse “small changes” problem — appending a single row to a file-based format like Iceberg typically means rewriting a manifest file, which gets expensive at high update frequency. Because DuckLake manages metadata in a real database instead, DuckDB Labs’ own benchmarking reported query performance roughly 900x faster and ingestion roughly 100x faster than Iceberg on small, frequent changes.
- A “multiplayer” model — multiple DuckDB instances can read and write to the same DuckLake concurrently, coordinating through the shared catalog database, without a central compute bottleneck.
Worth knowing before you commit to it:
- DuckLake is genuinely new — the format was first published in mid-2025 and only recently reached a stable, production-ready v1.0 specification. It’s maturing fast, but doesn’t have the multi-year production track record that Iceberg or Delta Lake do.
- The catalog database (Postgres, SQLite, or DuckDB) becomes a real dependency — beyond local prototyping, you’re managing a small, always-available database alongside your object storage.
- Tooling and ecosystem support (BI tools, orchestration integrations) is growing but is still smaller than the Iceberg ecosystem, which has years of head start.
For a team already running DuckDB as the compute engine, DuckLake is a natural fit — it’s built by the same project, and it can attach to existing Parquet data without copying it, so adopting it doesn’t require re-architecting the storage layer.
3. Apache Superset — The Visualization Layer
Superset is an open-source, Apache 2.0-licensed data exploration and BI platform. It connects to any SQL-speaking database, DuckDB included, through a standard driver.
What it actually gives a team:
- SQL Lab — a full SQL IDE for analysts who want to write and iterate on queries directly.
- Explore — a no-code chart builder for everyone else, with 40+ chart types out of the box, including geospatial visualizations.
- Role-based access control — built-in Admin, Alpha, Gamma, and Public roles, plus custom roles scoped to specific datasets or databases.
- Row-level security — filters that automatically restrict which rows a given user or role can see, which matters if multiple teams or clients share the same dashboards.
- Dashboard embedding — dashboards and charts can be embedded into other applications via SDK, rather than requiring users to log into Superset directly.
The honest caveat: Superset isn’t a zero-maintenance tool. Getting real value out of RBAC, row-level security, and embedding takes genuine platform-engineering time — it’s a strong fit for a team with at least some dedicated capacity to own the deployment, not a drop-in replacement for a fully managed BI SaaS product.
4. React + Node.js — The Data View System
This is the one component we built rather than adopted. It sits between the raw DuckDB/DuckLake layer and the people using the data.
What it’s responsible for:
- Defining reusable data views — pre-modeled datasets that hide the underlying SQL from non-technical users.
- Managing query abstraction, so the frontend never constructs raw SQL directly.
- Enforcing access control and transformations at the API layer, on top of whatever Superset or DuckDB handle natively.
- Powering UI-driven analytics — filters, dataset selection, and dashboard rendering through a plain interface rather than a query editor.
This layer is deliberately small in scope. It isn’t trying to replace Superset’s visualization or DuckDB’s query engine — it exists purely to make the platform usable by people who aren’t going to write SQL, which is a real gap the other three tools don’t close on their own.
How Data Flows Through the Analytics Platform
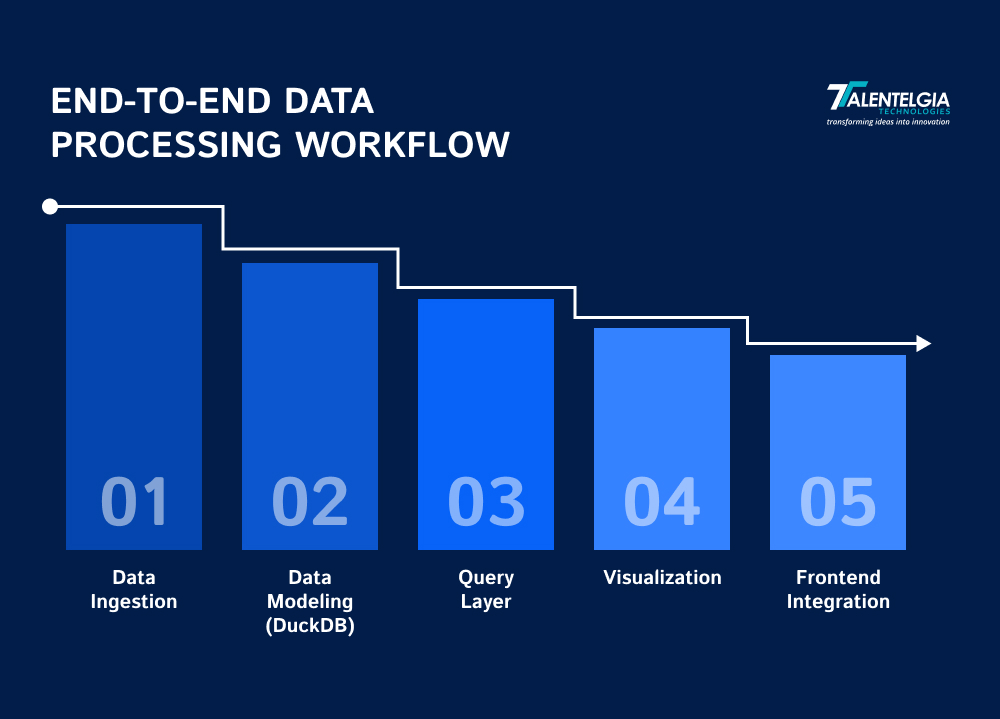
Once the stack is in place, data moves through five stages to go from a raw file sitting somewhere to a dashboard someone’s actually looking at.
Step 1: Data Ingestion
It starts with raw data: CSV, JSON, or similar file types, arriving from whatever source. That raw file gets converted into Parquet format, and the converted file is stored in object storage. This is the only real “transformation” step in the whole pipeline, and it’s a light one by design.
Step 2: Data Modeling (DuckDB)
Once the Parquet files are sitting in object storage, DuckDB creates external tables directly over them. There’s no import step, no copying data into a separate database. On top of those tables, views get defined to encode the actual business logic: joins between datasets, calculated fields, filtered subsets that matter for a particular report or dashboard.
Step 3: Query Layer
A Node.js API sits between the data and whoever’s asking for it. When a request comes in, it executes the relevant DuckDB query and applies whatever dynamic filters or aggregations the frontend is asking for, so the same underlying view can serve different filtered slices depending on who’s looking and what they need.
Step 4: Visualization
Superset connects to DuckDB and builds dashboards on top of the views defined back in Step 2, not on the raw files directly. This matters because it means the dashboard logic stays consistent with whatever business rules were baked into the views, instead of every chart reinventing its own version of the same query.
Step 5: Frontend Integration
Finally, the React UI consumes the Node.js API and turns it into something a person can actually use — dashboards, filters, and views, all without anyone needing to write a line of SQL.
Each of these five steps relies on one purpose-built tool doing one job. The only piece that’s custom-built end to end is the data view layer connecting them, which keeps the amount of code the team actually has to maintain small, compared to what a full ETL and orchestration setup would require.
What This Replaces, and Why It Holds Up
Swap out Snowflake or BigQuery, ETL pipelines, and dedicated data marts, and what’s left is DuckDB querying Parquet files directly through DuckLake’s catalog, with transformation logic kept intentionally lightweight.
Why it works technically:
- Columnar storage means scans only touch the columns a query actually needs, not entire rows.
- Vectorized execution processes data in batches, which is where DuckDB’s benchmark performance advantage over row-oriented systems comes from.
- No separate load step into a warehouse means no data duplication to keep in sync.
- DuckLake’s catalog-based metadata avoids the file-rewrite overhead that makes frequent small updates expensive in older lakehouse formats.
Cost-Efficient Analytics Stack (Under $50/month)
| Component | Estimated Monthly Cost |
|---|---|
| Object storage (S3 or local) | $10–20 |
| Compute (local or lightweight server) | Minimal |
| Superset hosting | $10–20 |
| Backend API | ~$10 |
| Total | Under $50/month |
These are illustrative figures for a small-to-medium workload, not a guaranteed number for every deployment. But directionally, it’s a different category of spend than a warehouse-based setup, where compute credits and storage at scale routinely push monthly costs into the hundreds or thousands, and a Spark cluster higher still.
- Snowflake / BigQuery → $100s–$1000s
- Spark clusters → even higher
Batch vs. Real-Time: A Hybrid Approach
A common assumption is that “real-time” data requires a dedicated streaming pipeline like Kafka, Flink, and the operational overhead that comes with them. This stack handles it differently.
- Batch processing handles the heavy lifting like scheduled ingestion jobs, precomputed datasets, and standard reporting where a few minutes or hours of latency is acceptable.
- Near real-time queries run directly against the latest files in object storage; DuckDB is fast enough to query fresh data on demand for most use cases, without any streaming infrastructure.
- The hybrid model blends both: batch pipelines run the expensive transformations on a schedule, while real-time queries handle the cases where freshness matters more than pre-aggregation.
For teams without genuinely sub-second latency requirements, which is most teams, this covers the real-time use case without the operational cost of a full streaming system.
Making It Usable: The Data View Layer, in Detail
DuckDB, DuckLake, and Superset together solve the technical half of this platform: fast queries, cheap storage, working dashboards. But none of them, on their own, solve the problem of a non-technical person needing to answer a question from the data without knowing SQL. That’s the gap the Data View Layer was built to close — it sits between the raw data and everyone who isn’t going to write a query to get what they need.
Key Features of the Data View Layer
Define reusable datasets
Instead of every dashboard or report starting from scratch, a dataset gets defined once — the tables it pulls from, the joins it needs, the fields that matter — and then gets reused wherever it’s needed. This means the underlying logic only has to be built and verified a single time, rather than every consumer of that data quietly building their own slightly different version of the same thing.
Abstract SQL complexity
The whole point of this layer is that nobody using it needs to know SQL exists. Whatever joins, filters, or transformations are happening underneath get hidden behind a UI, so a person can select a dataset, apply a filter, and see a result, without ever seeing or touching the query that produced it.
Apply filters dynamically
Filters aren’t hardcoded into the dataset definition. A user can narrow down by date, category, region, or whatever fields are relevant, and the system applies that filter at query time, without needing to redefine or duplicate the dataset for every possible combination someone might want to look at.
Role-based access control
Not everyone should see the same data. This layer enforces who has access to what, at the level of the data view itself, so the same dashboard infrastructure can serve different users with different visibility, instead of needing separate dashboards built for every access level.
Data View Layer Architecture
The system is split across three layers, each with a specific job:
Frontend (React)
- A UI for selecting which dataset to work with
- A filter builder, so users can narrow results themselves
- Dashboard rendering, turning the underlying data into something visual and readable
Backend (Node.js)
- A query builder that translates whatever the frontend is asking for into an actual query
- The DuckDB execution layer, which actually runs that query against the data
- API endpoints that connect the frontend to all of this, cleanly
DuckDB Layer
- The views and transformations that were defined once and get reused across every dashboard pulling from them
- Query optimization, so the same view performs well no matter how many different filters or dashboards are querying it
Put together, these three layers mean a data view gets defined exactly once, filters, access rules, and transformations all baked in from the start. And from that point on, it’s just reused. Nobody downstream needs to understand the schema, write a join, or know where the underlying Parquet files live. They just pick a dataset, apply a filter, and get an answer.
Benefits of This Approach
- Performance — analytical queries run fast without a compute cluster behind them.
- Cost savings — no warehouse credits, no cluster licensing, no idle compute sitting around.
- Simplicity — four components instead of a dozen, with far fewer moving parts to monitor and patch.
- Flexibility — works equally well with flat files, APIs, or object storage as the data source.
- Scalability within reason — comfortably handles datasets from gigabytes into the low terabytes, depending on tuning; it isn’t the right tool past that.
Where This Stack Fits — and Where It Doesn’t
Best Use Cases
- Startups and small teams
- Internal analytics platforms
- Embedded analytics inside a product
- Cost-sensitive environments
- Rapid prototyping, where standing up a full warehouse would be premature
When This Architecture Isn’t the Right Choice
- Massive distributed workloads running into multiple petabytes
- Systems needing genuinely ultra-low-latency streaming (milliseconds, not seconds)
- Teams needing heavy multi-user concurrent writes at scale, where DuckDB’s single-node design becomes a real constraint
Those problems still call for Spark, Flink, ClickHouse, or a dedicated warehouse. But that’s a smaller slice of real-world analytics workloads than the default architecture choice usually assumes.
Final Thoughts
If you're building analytics for a startup or an internal product, this stack gets you there faster to set up, cheaper to run, and easier to maintain, with full control over your own data. And once the infrastructure stops being the hard part, the work — finding insights in the data — gets a lot more of your attention.










 Sales Enquiries:
  Business queries:
  HR:
HR: 


