
 Healthcare App Development Services
 Real Estate Web Development Services
 E-Commerce App Development Services
 E-Commerce Web Development Services
 Blockchain E-commerce Development Company
 Fintech App Development Services
 Fintech Web Development
 Blockchain Fintech Development Company
 E-Learning App Development Services
 Restaurant App Development Company
 Mobile Game Development Company
 Travel App Development Company
 Automotive Web Design
 AI Traffic Management System
 AI Inventory Management Software
 AI Development Company
  ChatGPT integration services
  AI Integration Services
  Generative AI Development Services
  Natural Language Processing Company
 Machine Learning Development
  Machine learning consulting services
  Blockchain Development
  Blockchain Software Development
  Smart Contract Development Company
  NFT Marketplace Development Services
  Asset Tokenization Company
 DeFi Wallet Development Company
 Mobile App Development
  IOS App Development
  Android App Development
  Cross-Platform App Development
  Augmented Reality (AR) App Development
  Virtual Reality (VR) App Development
  Web App Development
  SaaS App Development
 Flutter
  React Native
  Swift (IOS)
  Kotlin (Android)
  Mean Stack Development
  AngularJS Development
  MongoDB Development
  Nodejs Development
  Database Development
 Ruby on Rails Development
 Expressjs Development
  Full Stack Development
  Web Development Services
  Laravel Development
  LAMP Development
  Custom PHP Development
  .Net Development
  User Experience Design Services
  User Interface Design Services
  Automated Testing
  Manual Testing
  Digital Marketing Services
 Ride-Sharing And Taxi Services
 Food Delivery Services
 Grocery Delivery Services
 Transportation And Logistics
 Car Wash App
 Home Services App
 ERP Development Services
 CMS Development Services
 LMS Development
 CRM Development
 DevOps Development Services
 AI Business Solutions
 AI Cloud Solutions
 AI Chatbot Development
 API Development
 Blockchain Product Development
 Cryptocurrency Wallet Development
 About Talentelgia
  Our Team
  Our Culture
 Healthcare App Development Services
 Real Estate Web Development Services
 E-Commerce App Development Services
 E-Commerce Web Development Services
 Blockchain E-commerce
Development Company
Blockchain E-commerce
Development Company Fintech App Development Services
 Finance Web Development
 Blockchain Fintech
Development Company
Blockchain Fintech
Development Company E-Learning App Development Services
 Restaurant App Development Company
 Mobile Game Development Company
 Travel App Development Company
 Automotive Web Design
 AI Traffic Management System
 AI Inventory Management Software
 AI Development Company
 ChatGPT integration services
 AI Integration Services
 Machine Learning Development
 Machine learning consulting services
 Blockchain Development
 Blockchain Software Development
 Smart contract development company
 NFT marketplace development services
 IOS App Development
 Android App Development
 Cross-Platform App Development
 Augmented Reality (AR) App
Development
Augmented Reality (AR) App
Development Virtual Reality (VR) App Development
 Web App Development
 Flutter
 React
Native
React
Native Swift
(IOS)
Swift
(IOS) Kotlin (Android)
 MEAN Stack Development
 AngularJS Development
 MongoDB Development
 Nodejs Development
 Database development services
 Ruby on Rails Development services
 Expressjs Development
 Full Stack Development
 Web Development Services
 Laravel Development
 LAMP
Development
LAMP
Development Custom PHP Development
 User Experience Design Services
 User Interface Design Services
 Automated Testing
 Manual
Testing
Manual
Testing About Talentelgia
 Our Team
 Our Culture
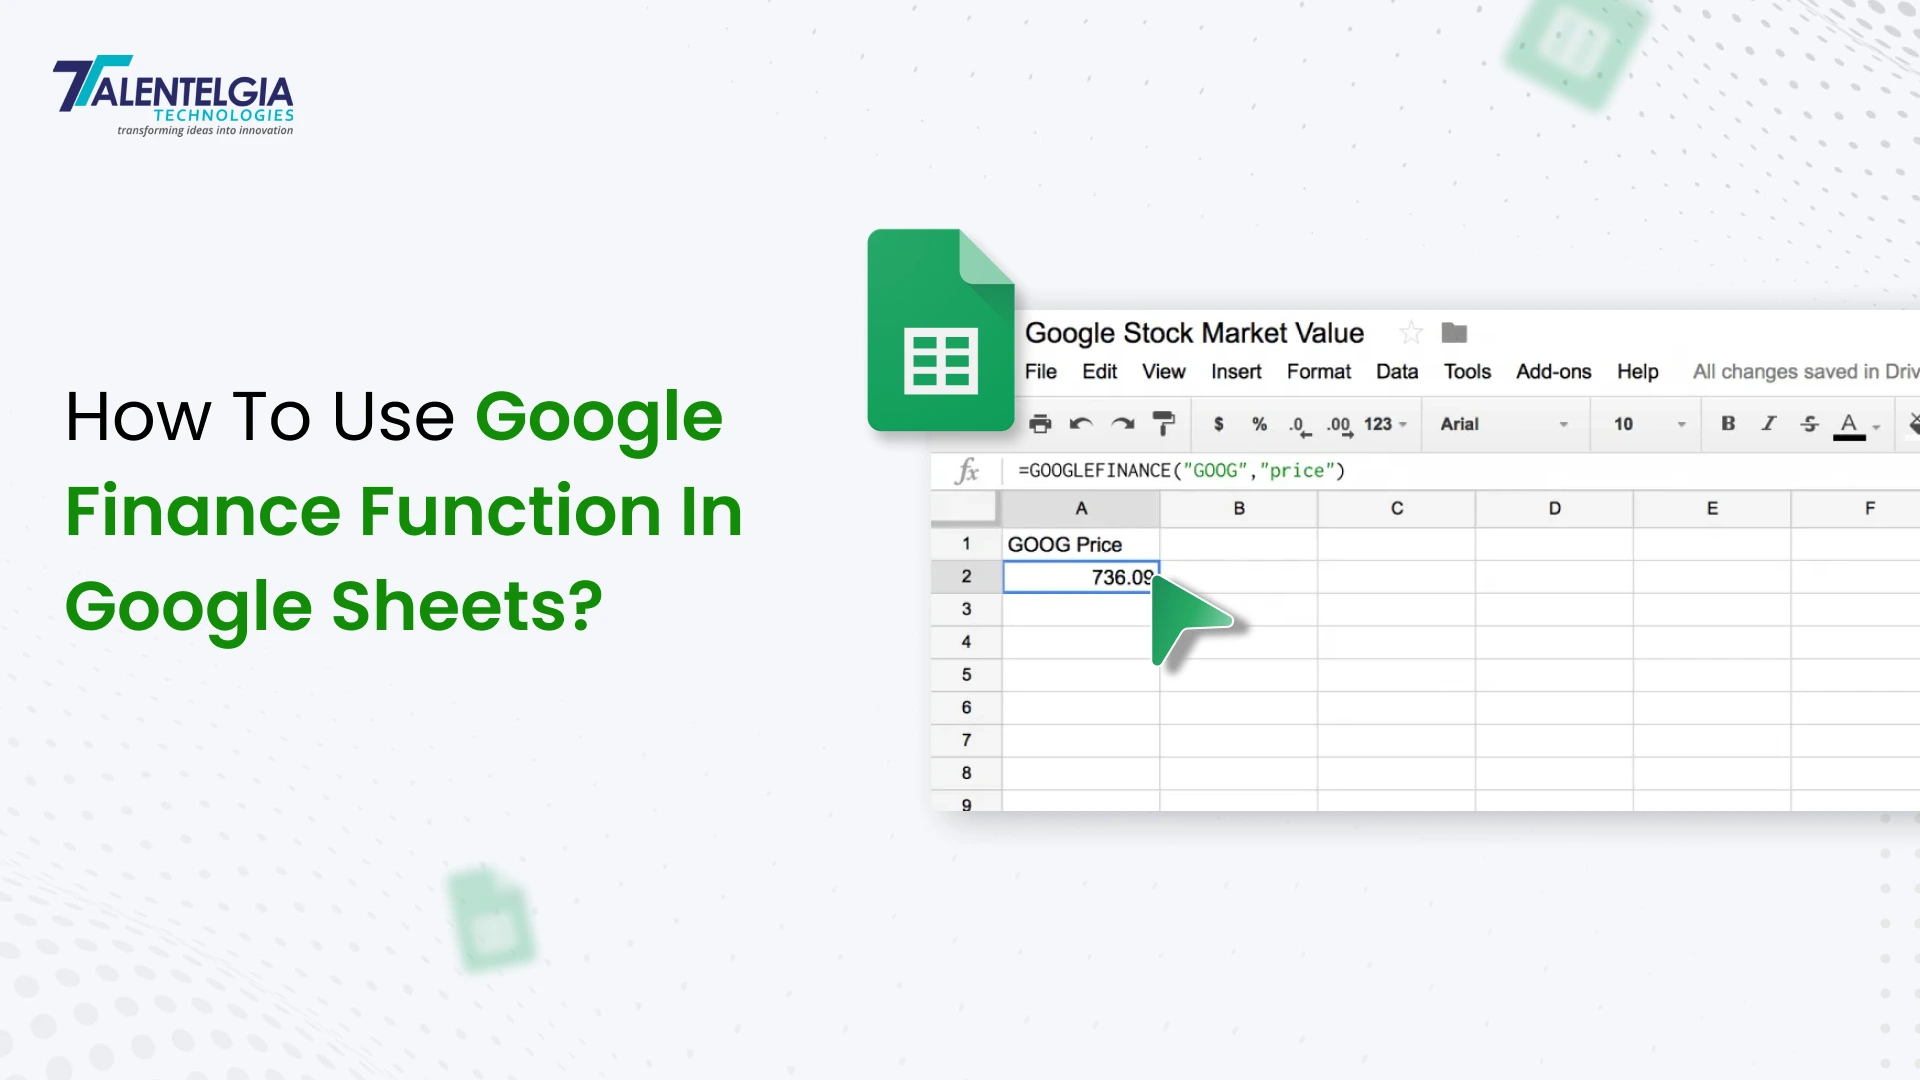
Do you recall the laborious and time-consuming task of tracking the prices of stocks and entering the records manually on spreadsheets? This tedious work involved typing a word or two into a search engine, copying some numbers, and then entering them into different cells of the spreadsheet. You then proceed with other stock, and a few minutes pass by, and you realize the prices of several stocks have changed, leaving you outdated already! You then grab the printed sheets and realize that you jumbled and messed up the prices of different stocks.
Many people have experienced this and hope never to repeat it again. Fortunately, the invention of the Google Sheets feature called “Google Finance” has made it easier to reduce the time-consuming processes and organize information in the most structured way. It’s almost like having a finance-savvy assistant. With the Google Finance function, you can effortlessly import real-time financial data, historical stock prices, and currency exchange rates directly into your Google Sheets.
Understanding Google Finance Function: Syntax Breakdown
Many of you are familiar with Google Finance as a tool to explore investment options and other financial data. It enables you to build and manage your own stock portfolio, tracking it in real time. Additionally, it provides updates on securities, currency exchange rates, and more, all in one convenient location. What you might not know is that Google Sheets offers a special formula called “GOOGLEFINANCE.” This formula lets you pull in data directly from Google Finance into your spreadsheets.
For more insights on improving your financial strategies, you may also want to check out Top 7 Financial Analysis Tools To Boost Your Business ….
The formula can seem a bit complex at first, so we’ve created this easy-to-follow guide to help you master GOOGLEFINANCE confidently and without hassle..
What Is Google Finance Formula?
At its core, the GOOGLEFINANCE function fetches current or historical securities information, such as stock prices, exchange rates, or market capitalization for publicly traded companies and currencies worldwide. The function takes a ticker symbol (a short code identifying stocks or currencies), a data attribute to specify the type of information you want, and optional parameters like date ranges and intervals.
Key Features & Advantages:
- Real-time and historical data access: Pull live stock prices or detailed historical pricing and volume trends effortlessly.
- Supports stocks, mutual funds, currencies, and indices: Versatility to cover multiple asset classes and markets globally.
- Customizable data retrieval: Specify attributes such as price, volume, market cap, P/E ratio, and many more.
- Dynamic updates: Your sheet automatically refreshes data to reflect changes in the financial markets.
- Simple syntax: A user-friendly formula with flexible parameters that anyone familiar with spreadsheets can master.
- Automate investment tracking and budgeting: Build dashboards or conversion tools with accurate, up-to-date financial data without external software or APIs.
Mastering the Google Finance formula empowers you to bring the complexity of financial markets within easy reach, all while leveraging Google Sheets’ robust calculation and organizational capabilities. This guide will help you navigate from basic queries to creating advanced, insightful financial analyses step by step.
Syntax of Google Finance Function
The GOOGLEFINANCE function in Google Sheets is designed to fetch real-time or historical financial data from Google Finance straight into your spreadsheet with ease. Understanding its syntax is essential to harnessing its full potential for tracking stocks, currencies, and other market data.
Basic Syntax of the function :
=GOOGLEFINANCE(ticker, [attribute], [start_date], [end_date|num_days], [interval])Let’s break down its components to see what each part means and how to use them:
- Ticker (required): This is the symbol that identifies the security or currency you want information about. It’s usually a combination of the stock exchange and the ticker symbol separated by a colon, for example, “NASDAQ: GOOG” for Google’s stock on NASDAQ. For currency exchange rates, it looks like “CURRENCY: USDGBP” to convert USD to GBP. Always enclose the ticker in quotes.
- Attribute (optional): Defines what type of financial data to retrieve. Some common attributes include “price” (real-time price), “priceopen” (opening price for the day), “high” (highest price of the day), “low” (lowest price), “volume”, “marketcap”, and “pe” (price-to-earnings ratio). If you leave this blank, it defaults to “price”.
- start_date (optional): The starting date for historical data you want to retrieve. Use standard date formats and enclose the date in quotes or reference a cell containing a date. If omitted, the function assumes today’s date.
- end_date|num_days (optional): Specifies either the end date for historical data or the number of days from the start date to retrieve data for. Omitting this parameter results in data for a single day if start_date is provided.
- Interval (optional): Defines the frequency of the data, such as “DAILY” or “WEEKLY”. The default is “DAILY”.
Attributes to Use In Google Sheets:
Here is a table of the common GOOGLEFINANCE attributes separated into real-time and historical data categories:
| Attribute (Real-Time Data) | Description |
| “price” | Real-time stock price (delayed up to 20 minutes) |
| “priceopen” | Opening price of the current trading day |
| “high” | Highest price of the current trading day |
| “low” | Lowest price of the current trading day |
| “volume” | Trading volume for the current day |
| “marketcap” | Market capitalization of the stock |
| “tradetime” | Time of the last trade |
| “datadelay” | Delay time of the real-time data |
| “volumeavg” | Average daily trading volume |
| “pe” | Price-to-earnings ratio |
| “eps” | Earnings per share |
| “high52” | Highest price over the last 52 weeks |
| “low52” | Lowest price over the last 52 weeks |
| “change” | Change in stock price since the previous close |
| “changepct” | Percentage change since previous close |
| “closeyest” | Previous day’s closing price |
| “beta” | Beta value (volatility indicator) |
| “shares” | Number of outstanding shares |
| “currency” | Currency in which the stock is priced |
| Attribute (Historical Data) | Description |
| “open” | Opening price during the specified period |
| “close” | Closing price during the specified period |
| “high” | Highest price during the specified period |
| “low” | Lowest price during the specified period |
| “all” | Returns open, close, high, low, and volume data for the period |
| “volume” | Trading volume during the specified period |
Using Google Finance Formula In Google Sheet: Step-by-Step Tutorial
The GOOGLEFINANCE function can seem like magic—it pulls live financial data straight into your spreadsheets, empowering you to track markets, analyze trends, and make smarter decisions. Here’s a practical, step-by-step tutorial covering the key use cases.
1. Track Stocks Using the GOOGLEFINANCE Formula
Tracking a stock’s current price or trading data in Google Sheets is as simple as plugging in the ticker symbol.
- Basic real-time price:
=GOOGLEFINANCE("NASDAQ:GOOG") This returns Google’s current stock price, delayed by up to 20 minutes due to market data restrictions.
- Tracking multiple attributes: Add an attribute to fetch more details
=GOOGLEFINANCE("NASDAQ:GOOG", "priceopen") Returns today’s opening price. You can retrieve volume, market cap, P/E ratio, and others by changing the attribute. You can also feed a list of stocks and drag the formula down to auto-fill prices for a whole portfolio.
2. Get Historical Stock Data
For trend analysis or backtesting, historical stock prices are invaluable.
- Get closing prices over a date range:
=GOOGLEFINANCE("NASDAQ:MSFT", "close", DATE(2023,1,1), DATE(2023,1,31), "DAILY") This brings the daily closing prices for Microsoft in January 2023.
- Change interval:
Swap “DAILY” for “WEEKLY” to get weekly data points instead.
Historical queries pull complete tables, starting at your cell with dates in the first column and the specified attribute in the second, ideal for charting and deeper analysis.
3. Working with Currency
GOOGLEFINANCE also supports currency pairs, letting you track exchange rates live or historically.
- Track currency exchange rate: Returns how many British Pounds one US Dollar will buy right now.
=GOOGLEFINANCE("CURRENCY:USDGBP") - Historical currency rates: Fetches the daily closing rate for USD to Euro in June 2023.
=GOOGLEFINANCE("CURRENCY:USDEUR", "close", DATE(2023,6,1), DATE(2023,6,30), "DAILY")This makes budgeting for travel, imports, or analyzing forex easy and automatic.
4. Get Currency Exchange Value
Working with currency conversions is often complex, but GOOGLEFINANCE simplifies it.
- Convert amounts using live rates: If you want to convert 100 USD to GBP:
=100 * GOOGLEFINANCE("CURRENCY:USDGBP") This multiplies your amount by the real-time conversion rate.
- Create dynamic conversion tables: List currencies in one column and apply the formula next to each, creating instant conversion dashboards.
How Often Does GOOGLEFINANCE Function Update The Google Sheets?
GOOGLEFINANCE updates data roughly every 2 minutes, but actual market data may be delayed up to 20 minutes depending on the exchange. Google Sheets refreshes data when you open the file or make edits, and you can adjust recalculation settings to refresh more frequently. However, completely real-time data is not guaranteed, especially outside market hours.
Is Relying on GOOGLEFINANCE Function a Good Idea?
For most users, Yes! GOOGLEFINANCE is a free, easy way to import live and historical financial data without third-party tools. It’s perfect for investors, students, or small businesses needing quick insights. That said, it’s not ideal for high-speed trading or professional analytics, due to potential delays and limited advanced data. Overall, it’s a powerful, accessible tool for everyday financial tracking and analysis.
Wrapping It Up!
GOOGLEFINANCE turns your spreadsheet into a powerful financial command center—whether you’re following stocks, exploring historical trends, or managing currencies. The best part? It keeps your data up to date without manual fuss, freeing you to focus on analysis and decisions, not data entry.

This tutorial gives you a practical foundation, but combining GOOGLEFINANCE with other spreadsheet functions like IF, QUERY, or SPARKLINE can elevate your reports even further.

Time to grab a sheet and start experimenting!
Also Read: Finance Web Development


 Write us on:
  Business queries:
  HR:
HR: 


