Our Prometheus Development Servicesarrow

Your Go-To Partner For Prometheus Monitoring & Alerting Solutions

Our specialized Prometheus development services help businesses elevate system reliability, visibility, and performance. Here’s how we help you build smarter monitoring solutions.

featureOneImage
Real Time Metric Collection

Continuously collect, process, and analyze metrics from your apps, services, and infrastructure—ensuring immediate visibility and deep operational insights.

featureTwoImage
Alerting & Incident Management

Set intelligent alert thresholds and receive instant notifications when systems deviate from normal, helping your team react before users are affected.

featureThreeImage
Custom Dashboards & Visualization

Build intuitive Grafana dashboards integrated with Prometheus to visualize performance data in real time with customizable insights

featureFourImage
Secure Infrastructure Monitoring

Track usage, traffic, and load with Prometheus to scale proactively while ensuring data security and system uptime across distributed environments.

featureFiveImage
Historical Data Retention & Querying

Leverage PromQL to access, query, and explore past performance trends, helping teams make informed decisions through historical comparisons.

featureSixImage
DevOps Integration Support

Seamlessly integrate with Kubernetes, Docker, and CI/CD pipelines to streamline your DevOps workflows using Prometheus metrics and exporters.

Multiple Modules, One Unified Solution arrow

What Makes Our Prometheus Monitoring Tools So Powerful?

laptop

Metrics Dashboard Module

Visualize data . Analyze performance . Make smarter decisions

Designed for operations teams and engineers, this module offers rich real-time dashboards built with Grafana. It simplifies monitoring by aggregating Prometheus metrics in a unified interface for better resource planning, alert handling, and system health overview.

  • check
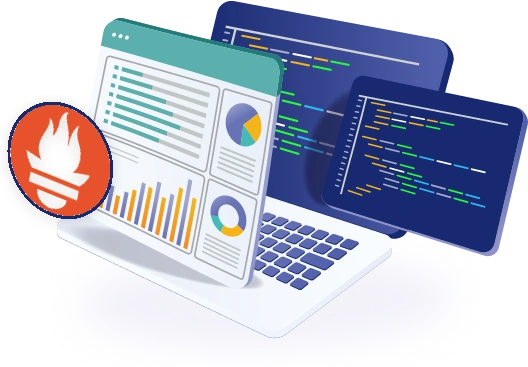
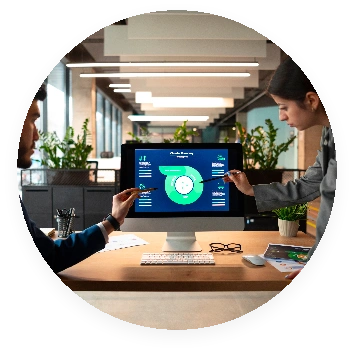
Real-time visualizations
  • checkCustom metrics grouping
  • checkPrometheus + Grafana integration
  • checkData refresh auto-sync

Alert & Notifications Engine

Stay ahead of failures—automatically

This engine lets you configure custom alerts using PromQL expressions. Integrated with popular notification tools (Slack, email, PagerDuty), it ensures you’re notified instantly when thresholds break or anomalies surface.

  • checkMulti-channel alert delivery
  • checkCustom severity levels
  • checkAuto-resolution detection
  • checkFlexible rule builder
mobile-app
mobile-app

Access & Permissions Control

Monitor smart . Monitor securely

Control who sees what with advanced role-based access systems. Whether you’re monitoring a distributed team or client-specific projects, this module ensures data integrity with user-specific dashboards and permission levels.

  • checkRBAC system
  • checkTeam-based visibility
  • checkAudit logs tracking
  • checkAPI token control
Client’s Testimonial arrow

Let’s Hear What Our Clients Say

How Do Our Prometheus Development Solutions Work? arrow

Experience Seamless Monitoring with Our Custom Prometheus Monitoring Workflow

TabOneImage
TabOneImage
01
Requirements Discovery

We analyze your current setup and future goals. Here, our Prometheus experts consult with your team to understand operational challenges, data sources, and integration points.

Book a Free Demo
TabTwoImage
arrow
02
Custom Development & Integration

Our developers build, integrate, and configure Prometheus for your apps, services, and infrastructure—connecting with Grafana, CI/CD, notifications, and automation tools as needed.

Book a Free Demo
TabThreeImage
arrow
03
Real Time Visualization & Dashboards

Dynamic dashboards and interactive panels are created to put actionable data at your fingertips. Easily monitor health, trends, and incidents across all layers in real time.

Book a Free Demo
TabFourImage
arrow
04
Testing, Training, Launch

Rigorous performance tests confirm reliability. We train your team on tools, incidents, and best practices, and then smoothly deploy your new monitoring environment.

Book a Free Demo
TabFiveImage
arrow
05
Ongoing Support & Optimization

Continuous support includes system updates, new feature integration, and optimization recommendations—so your monitoring grows as you do.

Book a Free Demo

Elevate System Monitoring By Hiring Our Prometheus Developers

Start your observability journey with confidence. Our expert Prometheus developers help you build scalable, intelligent, and proactive monitoring solutions tailored to your infrastructure.

Schedule a Call
section image
Prometheus Development Solution arrow

What Makes Us The Go-To Choice of Customers?

Harness innovation and intelligent observability as our Prometheus development expertise empowers businesses to scale with precision, reliability, and unmatched system insights!

Prometheus development company built for precision, scalability, and smarter infrastructure monitoring.

We specialize in delivering high-performance monitoring systems using Prometheus that go beyond simple data collection. With our deep understanding of cloud-native environments and time-series metrics, we craft intelligent observability solutions tailored to your ecosystem.

What sets us apart? Our relentless drive to innovate and adapt. We stay ahead of trends, contribute to the open-source community, and develop custom tooling for clients—ensuring they stay future-proof. Partner with us to hire Prometheus developers who turn chaos into clarity with dashboards that speak your language and alerts that actually matter.

Explore with us
development
Why Choose Us? arrow

Monitoring Excellence with Our Prometheus Development Experts

Hire Prometheus developers with hands-on experience in complex deployments, metric instrumentation, and custom exporters.

Our seasoned team has helped startups and enterprises monitor, debug, and scale mission-critical systems with precision and speed.

  • robust technologies
    Robust Technologies
  • faster solution
    Faster & Secure Solution
  • customization
    100% Customization

We don't just install Prometheus—we engineer it around your core objectives. Our team invests time to analyze your stack, workload patterns, and SLAs.

Whether you’re scaling a microservices setup or running high-throughput systems, we align your metrics pipeline with proactive alerting, optimized retention, and performance benchmarking, giving your teams the visibility they truly need.

  • robust technologies
    Robust Technologies
  • faster solution
    Faster & Secure Solution
  • customization
    100% Customization

Prometheus's power means nothing without clear visibility—our dashboards make data human. We create intuitive Grafana dashboards tailored to teams—DevOps, SREs, or C-level.

From node metrics to service latency, everything is beautifully organized for instant understanding. The UI is responsive, theme-ready, and built to eliminate confusion and help teams react in real time.

  • robust technologies
    Robust Technologies
  • faster solution
    Faster & Secure Solution
  • customization
    100% Customization

Your stack is unique—Prometheus should fit in, not fight back. We ensure seamless integration with your CI/CD pipelines, databases, cloud platforms, and other observability tools.

From auto-service discovery to webhook triggers, our team customizes Prometheus to talk effortlessly with your environment, minimizing configuration overhead and maximizing operational intelligence.

  • robust technologies
    Robust Technologies
  • faster solution
    Faster & Secure Solution
  • customization
    100% Customization

We keep things simple: no hidden clauses, just flexible models and honest pricing. Whether it’s full-cycle development or just performance tuning, our pricing is tailored to your needs and infrastructure scale.

With milestone-based deliverables and SLA-backed support, you stay in control and see measurable results—on your terms, without compromise.

  • robust technologies
    Robust Technologies
  • faster solution
    Faster & Secure Solution
  • customization
    100% Customization

Leading App Development Company Behind The Best Prometheus Development Services

Comparison
Custom Applications
Security Focus
Innovative Solutions
Scalability
High-end Solutions
SolutionImage
SolutionImage
SolutionImage
SolutionImage
SolutionImage
SolutionImage
SolutionImageOthers
SolutionImage
SolutionImage
SolutionImage
SolutionImage
SolutionImage

Frequently Asked Questions arrow

All Answers You Need To Know About Prometheus Development

Prometheus is an open-source monitoring and alerting toolkit designed for reliability and scalability. It collects real-time metrics, enables sophisticated querying, and provides instant alerting, making it a top choice for modern infrastructure and cloud-native environments.
Timelines depend on your requirements, but engagement can start in as little as a few days. After an initial consultation, we deliver a tailored roadmap for development, integration, and go-live—ensuring rapid results with minimized downtime.
Absolutely. Our Prometheus developers build seamless, secure integrations with popular tools like Grafana for visualization, Slack and PagerDuty for alerts, as well as integration with Kubernetes, AWS, GCP, Azure, and more.
Yes. We specialize in migrating data, alerting policies, and dashboards from platforms such as Nagios, Zabbix, and DataDog to Prometheus, ensuring a smooth and disruption-free transition to your new monitoring stack.
Security is central to our process. All configurations, integrations, and data handling are managed according to best practices—utilizing encryption, role-based access controls, and compliance with your organization’s required standards.
We offer a range of managed support packages, including monitoring upgrades, alert tuning, troubleshooting, and ongoing training. Our team is available for continuous optimization and rapid-response incident support.
Definitely. Every deployment is tailored—from custom metrics and dashboards to alert rules and third-party integrations—ensuring our Prometheus solutions fit precisely to your workflows and objectives.
Yes, we provide comprehensive onboarding and hands-on training to empower your DevOps, engineering, and business users to get the most from your new monitoring environment.

We're Here to Help

Have Questions? Contact Us

With a team of more than 150 expert developers and 10+ industry experience, our team has delivered more than 500 successful projects across the globe. Connect with us to shape your dream project into reality!

Fill out the Form to Get in Touch With us Now
Why Should You Connect With Us?
  • check Latest tech stack
  • check Experienced Developers
  • check Comprehensive packages
  • check Customer-centric approach
Schedule a Free consultantarrow
Phone

Our Blogs arrow

Stay up to date with our blogs on various techniques and technologies

cookies-icon

We use cookies on our website to give you the most relevant experience by remembering your preferences and repeat visits. By clicking “Accept”, you consent to the use of ALL the cookies.